-

Nginx Cache Failure
-
Switching to Astro
-
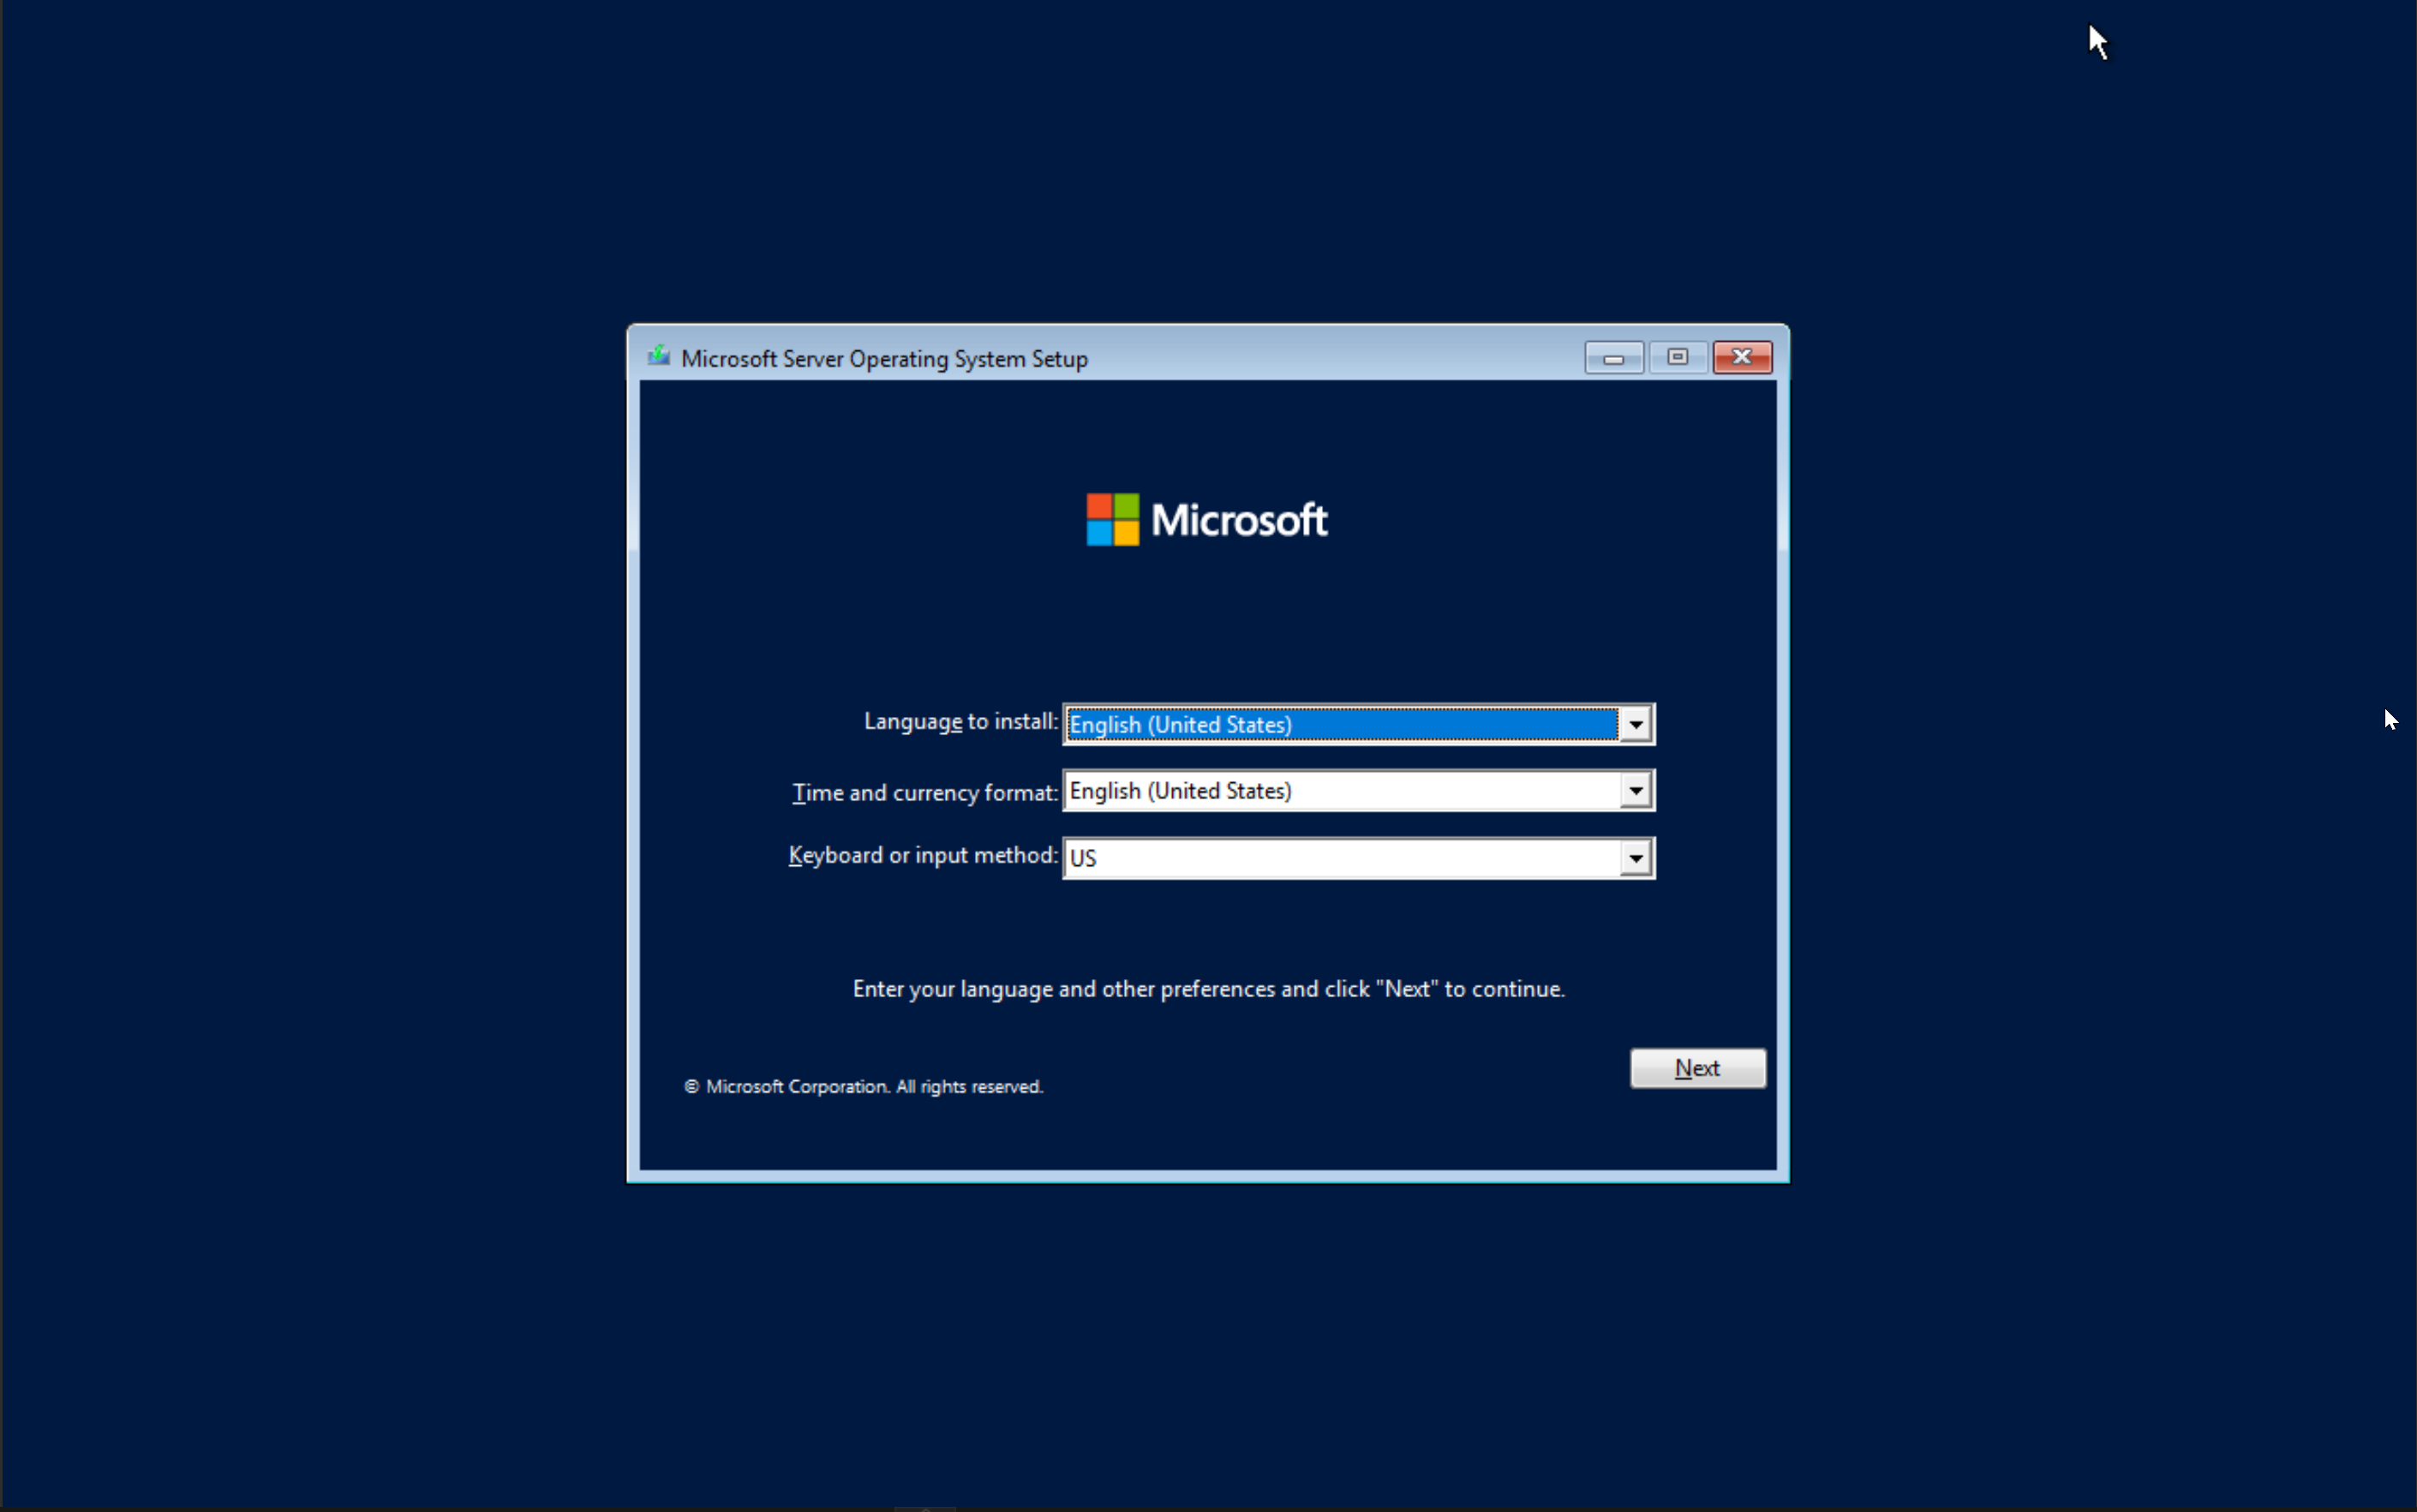
Guide: Installing Windows using WDS and MDT
-
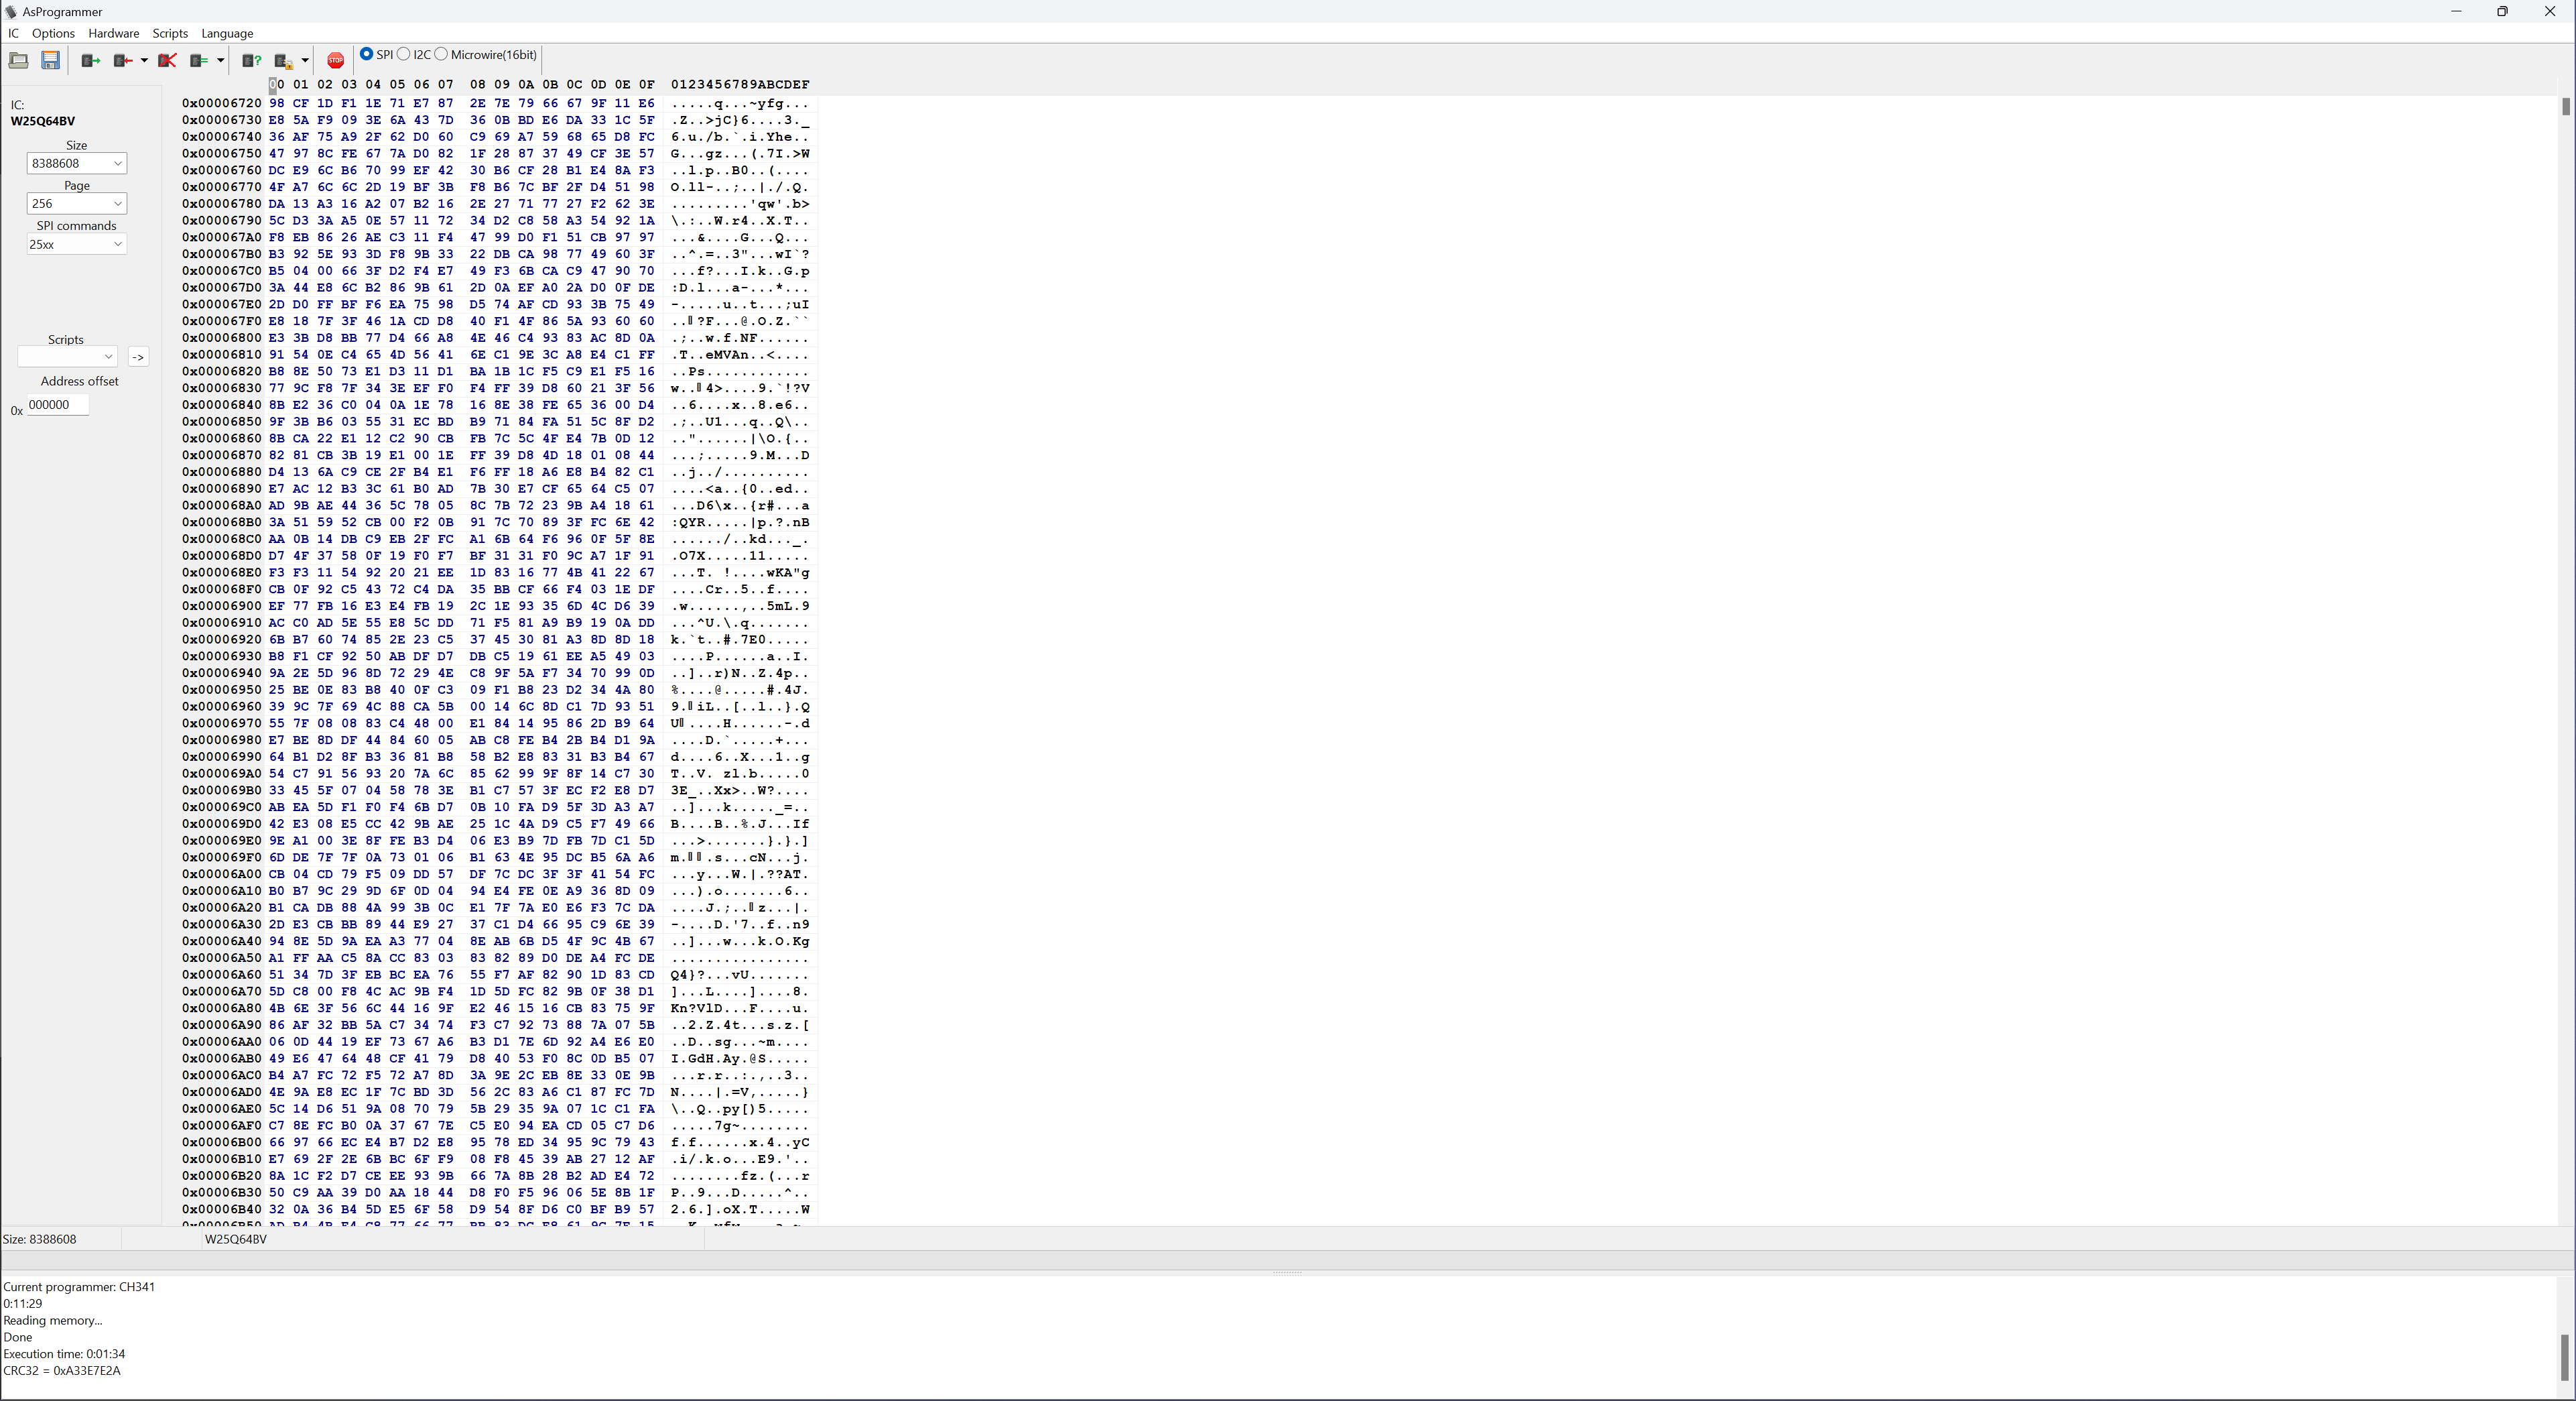
Guide: Flashing with a hardware programmer
-
Arc A770 First impressions
-
Arc A380 First impressions
-

Bacula blah
-

Screenconnect Woes
-
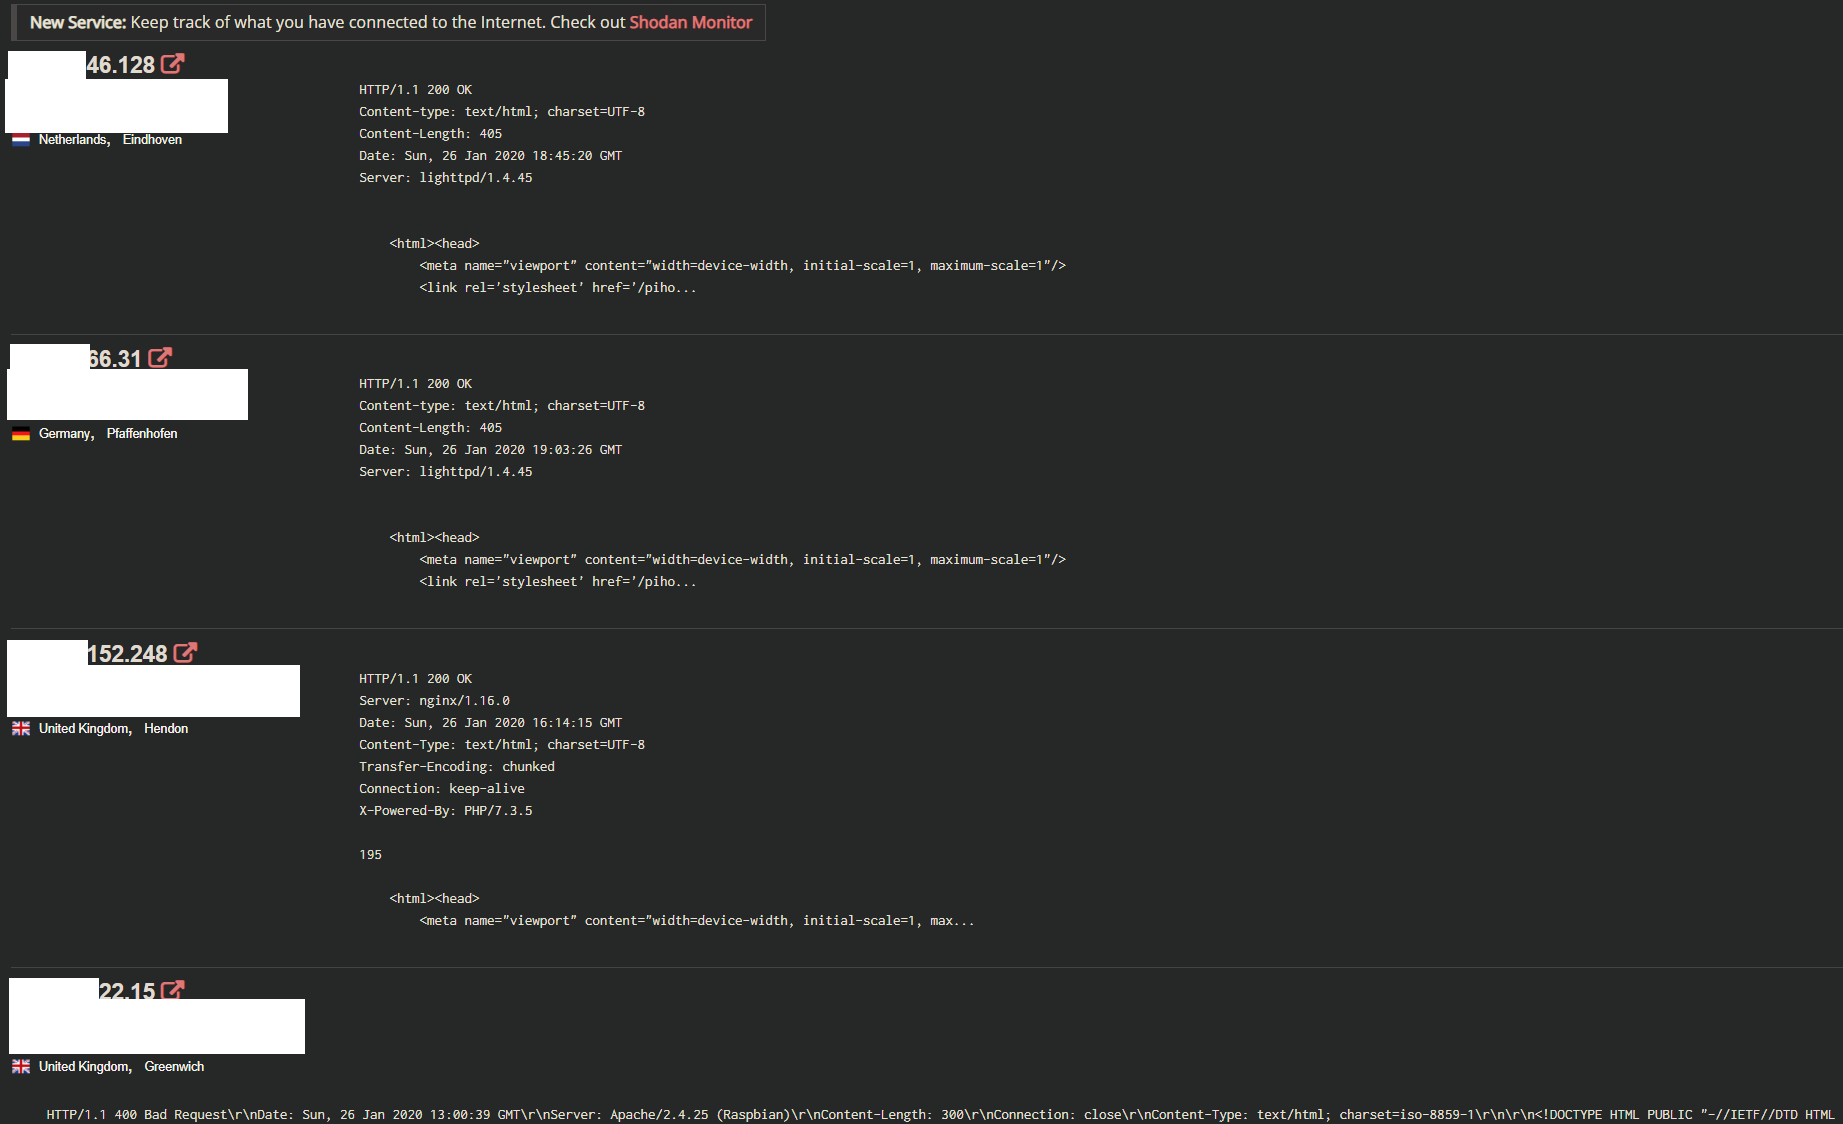
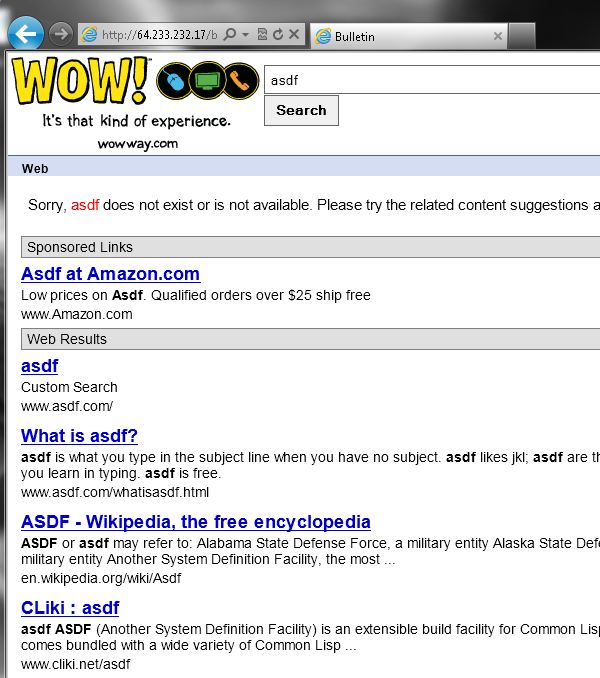
Educational: Anatomy of a public DNS break in
-
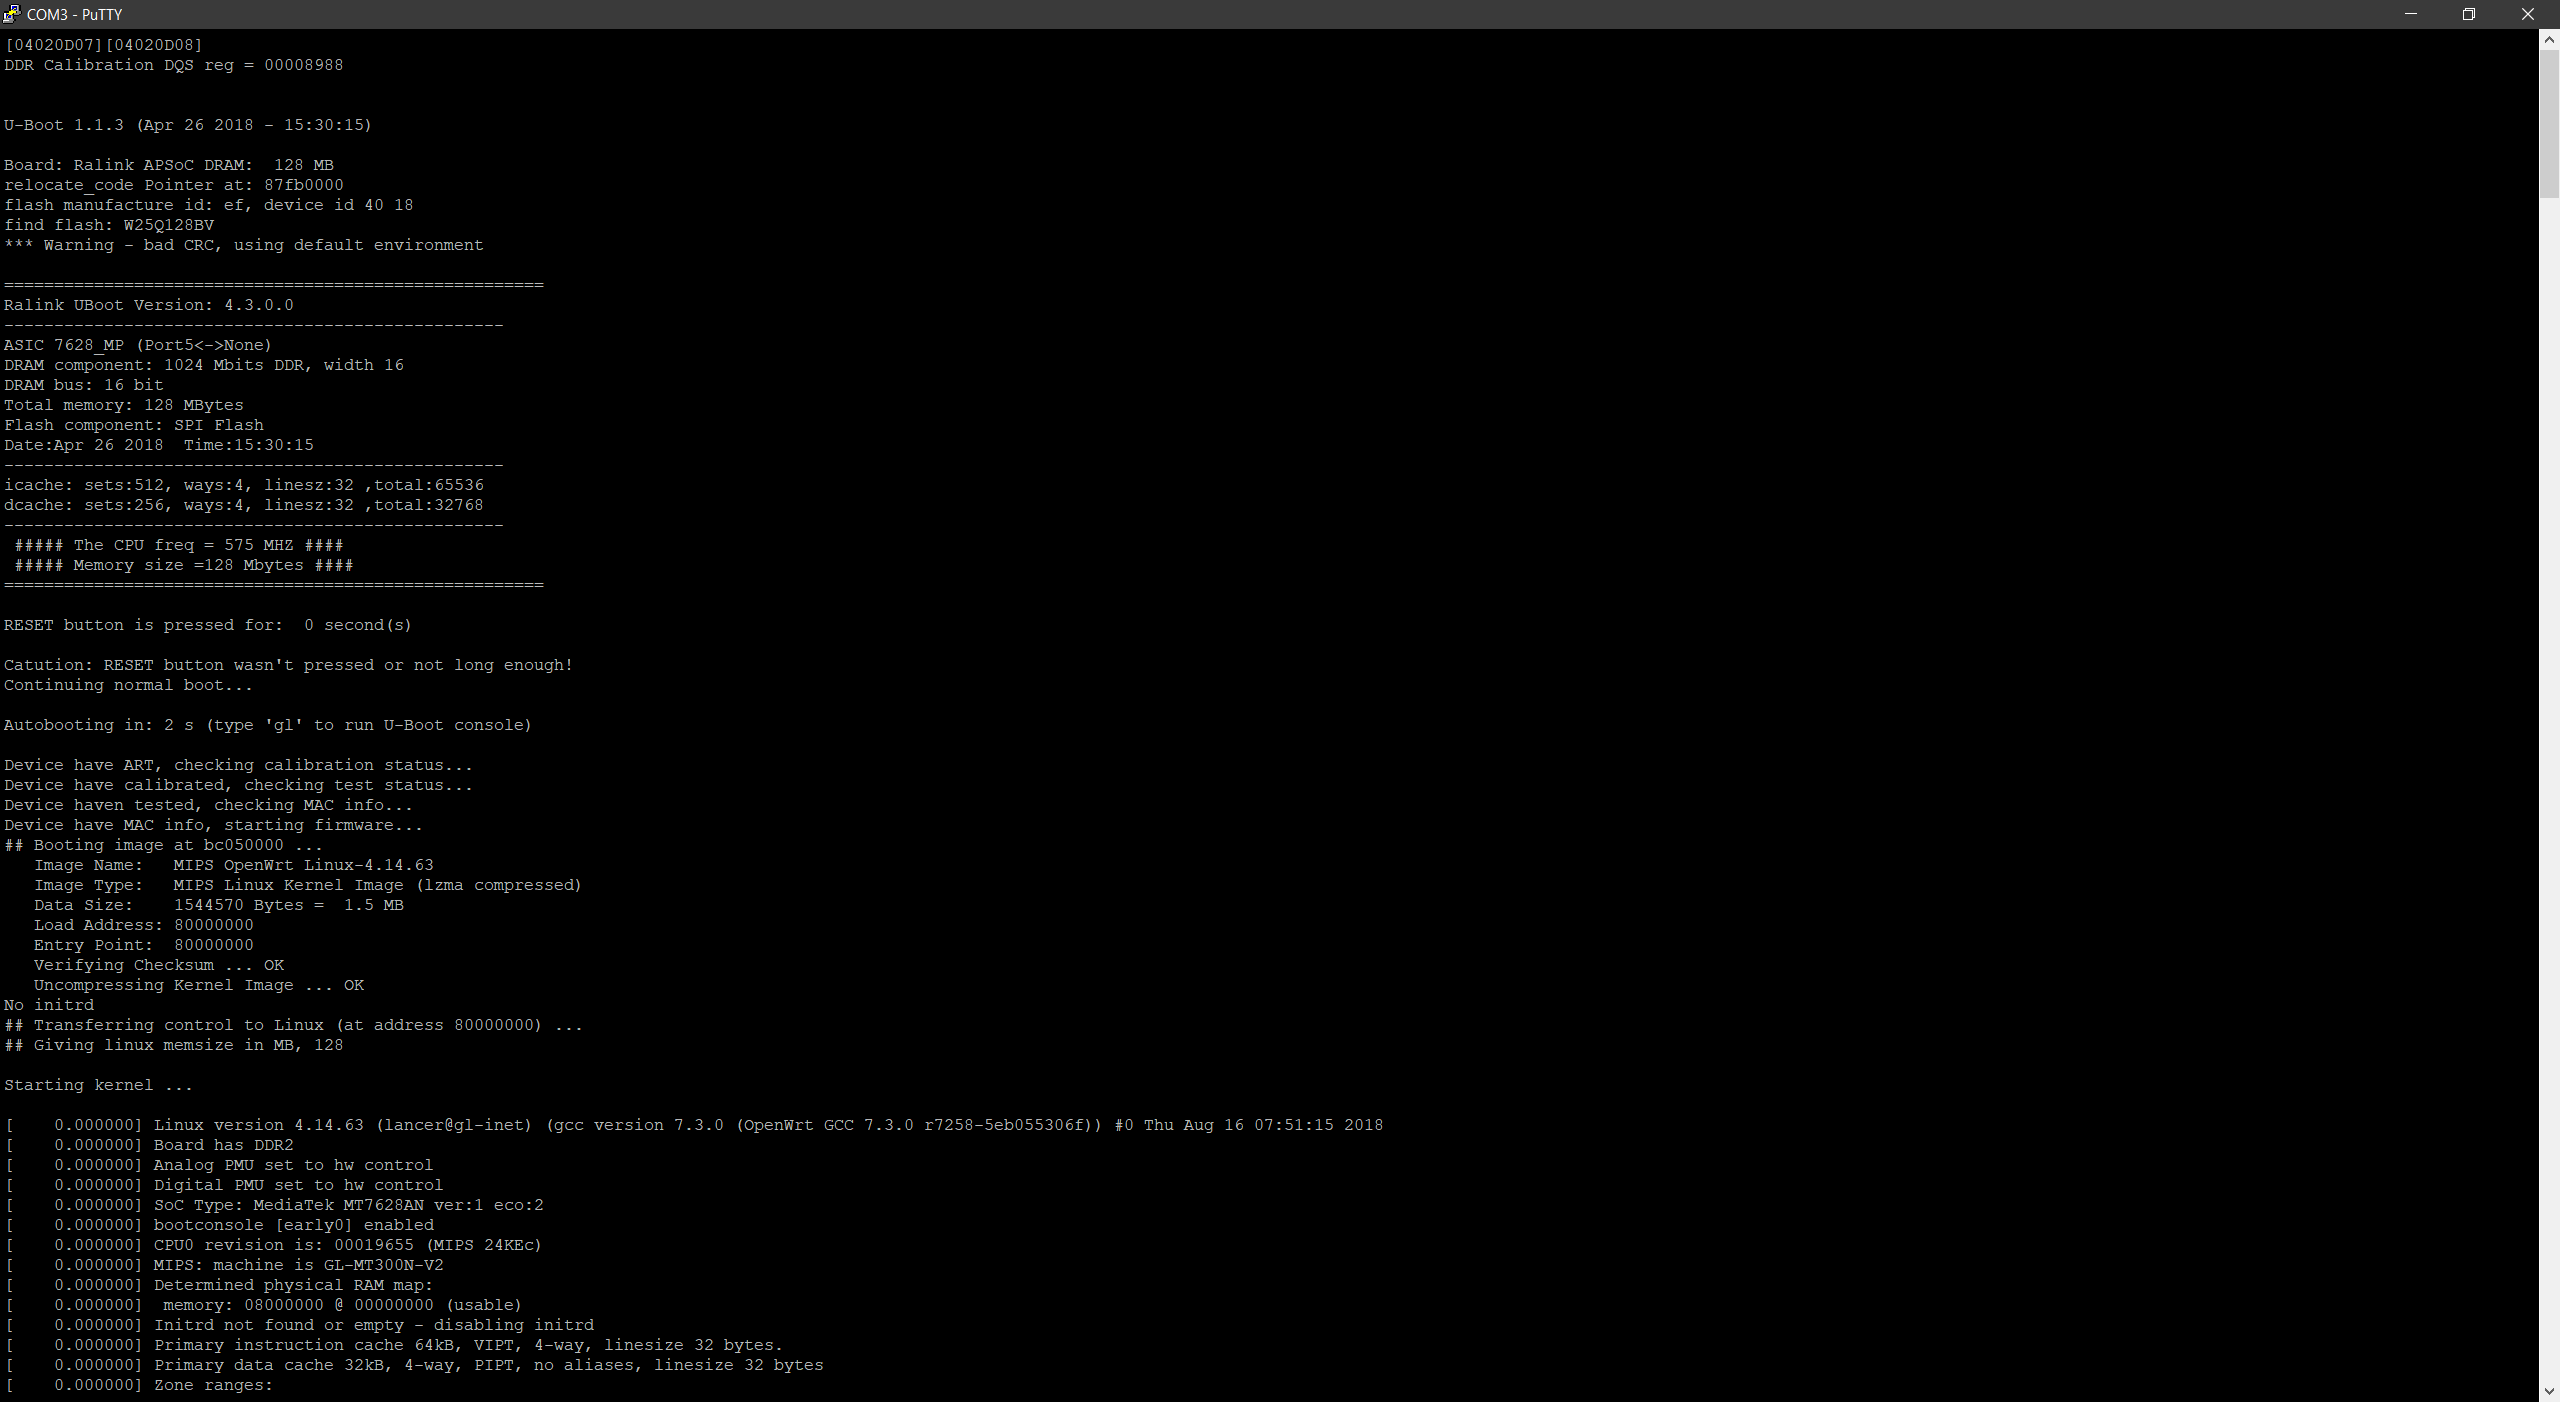
UART and you gaining root on random hardware
-
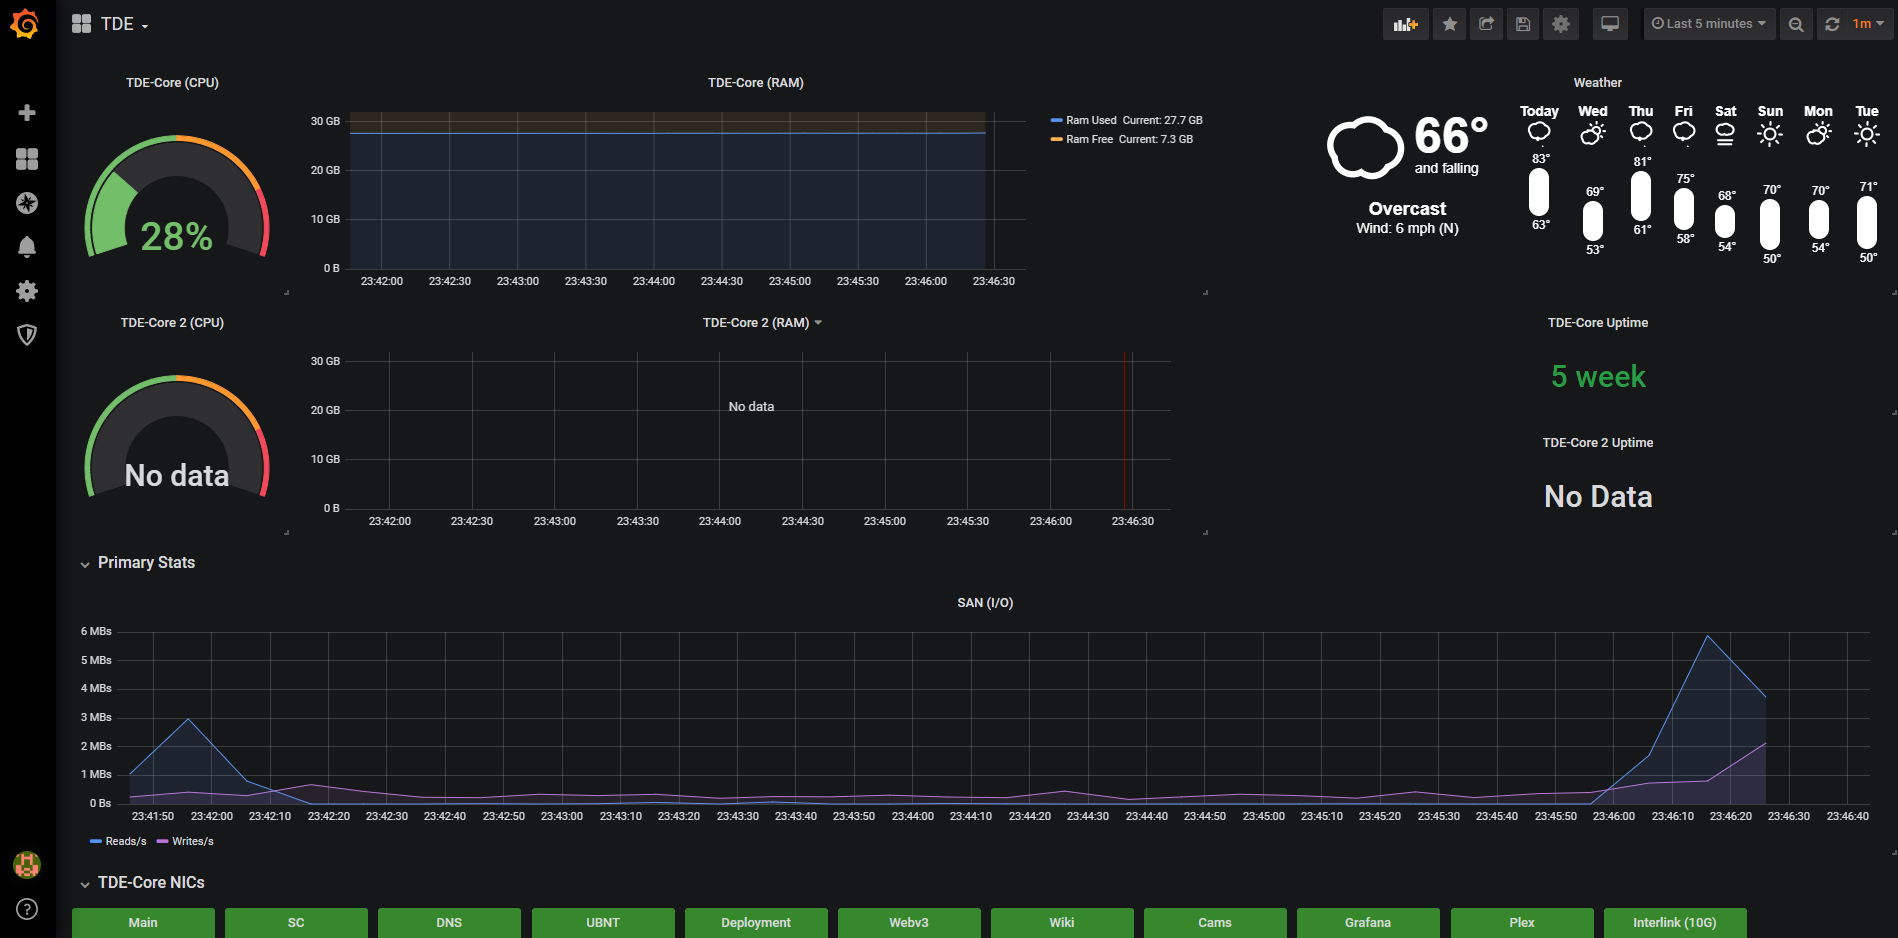
Pi-Graphs
-
Excuse me sir, where are you headed?
-

Permissions to the rescue